Meet a Monitor: Alyvia
By: Abby Hileman, Salt Watch Coordinator
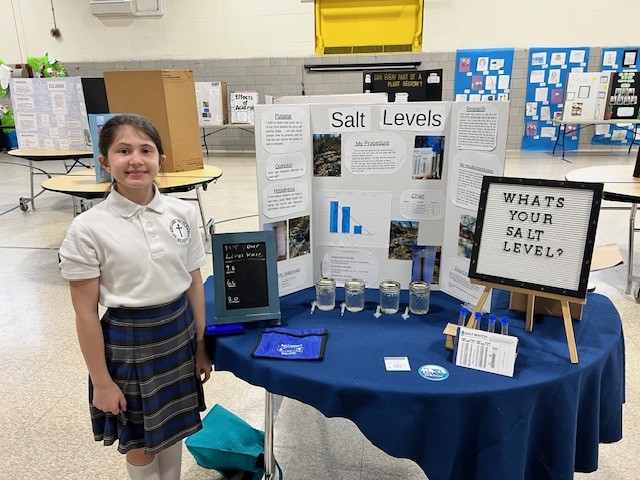
Alyvia (Liv) is an aspiring Egyptologist and a 6th grader at St Michael-St. Clement School in Maryland. In April 2025, Liv participated in her school’s science fair incorporating Salt Watch monitoring into her project. The theme for the fair was “Earth Science” and Liv knew that she wanted to create an interactive activity at her booth while also providing an educational display around an often unseen or unnoticed pollutant—salt.
Liv is no stranger to environmental issues and outreach. Her father works for the Montgomery County Department of Environmental Protection in Montgomery County, Maryland. I met Liv a few weeks before this interview at a local environmental festival while she was assisting at a DEP booth with her dad. She was a natural, talking with people and giving them free trash grabbers and handouts with program information.
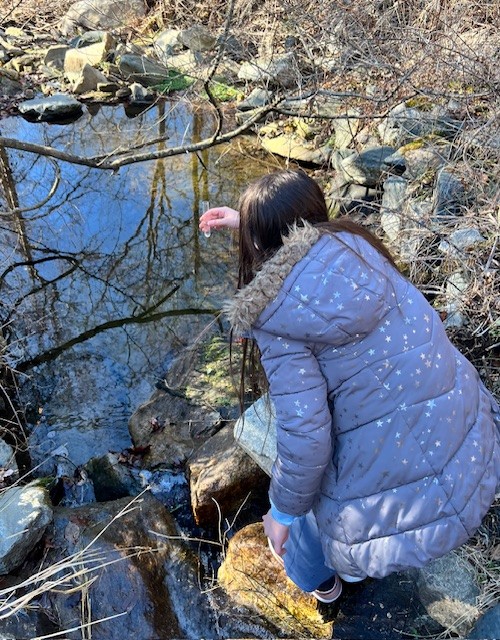
Starting in January 2025, Liv went out to collect water samples from three nearby streams. She made a hypothesis for her project that salt levels from road salt pollution runoff would be high in streams after winter storms in January, especially in streams near roadways. While streams sampled at the same time in more wooded areas were predicted to be less salty. Using a Salt Watch kit, she was able to determine the chloride levels (a common component of road salt deicers) in the sampled streams. After testing the water, Liv determined that her hypothesis was correct. However, she did not expect the chloride levels to be “off the charts” at one of her three sample locations.
“When we pollute something, it will eventually pollute us.”
~Alyvia
At one location that was tested, Liv noticed an absence of aquatic bugs or insects, which she thought might be due to excessive road salt pollution in the stream. That stream measured 404ppm or mg/L chloride, which is well over the chronically toxic limit set by the US EPA.1
Before the science fair project in April, Liv measured chloride levels again in those same streams and the chloride levels were significantly lower. The first stream, which was near a highway and originally had “off the charts” readings in January, was down to 404ppm chloride (still above the chronically toxic limit) in April. The second stream, which was observed to have a lack of freshwater aquatic insects and had tested at 404ppm chloride in January, was down to 103ppm chloride in April. And finally, the stream in the woods, which originally tested for 49ppm chloride in January, was below the level of the chart (around 25ppm chloride) in April.
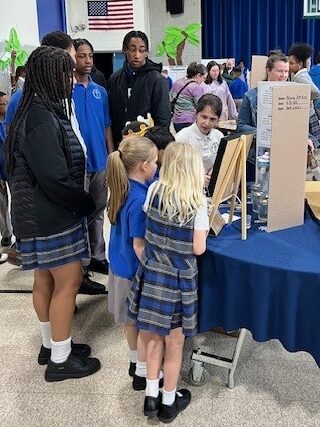
During the science fair, Liv had a table set up where attendees could learn how to use Salt Watch kits to take their own chloride samples. She brought extra water from her sampling in April for attendees to take a test strip, put the test strip into the water samples, and compare their results with results taken from the same waterways in January. This proved to be a great hands-on activity for students and adults. They were able to learn how easy it is to use a Salt Watch kit to learn more about what is happening in nearby waterways.
Many attendees knew that salt isn’t great for the environment and were shocked to learn how high the salt levels were in the waterways Liv tested. Many also hadn’t considered where salt goes once it is applied. They were surprised to learn that water flowing into storm drains lead directly to local waterways—like the ones tested for this project. At her table, attendees were also given tips on how to reduce salt at home, like using a scoop to measure salt and applying it in a spread-out pattern. And Liv dispelled myths like “more salt equals more melting.”
Liv plans to continue testing with Salt Watch and wants to test additional waterways in other states as well. When asked, “why should people care about road salt pollution?” she answered, “When we pollute something, it will eventually pollute us.” Road salt often ends up in our drinking water since it cannot be simply filtered out of water. Liv also suggested that we all do our part to point out oversalting events, so people start to notice excessive salt in the winter. This, with more education around the dangers of road salt pollution, will get more people to care about salt and to use less during the winter.
Alyvia received a recognition award for her science fair project and is already looking ahead to using Salt Watch for her 8th grade science fair project in a few years!
- An “off the charts” reading for a Salt Watch kit means that the chloride level exceeded 650ppm or mg/L. To put this into perspective, 230ppm or mg/L chloride is chronically toxic to freshwater aquatic life according to the United States Environmental Protection Agency (US EPA), meaning that the water is too salty for many freshwater organisms to survive over a short period of time. Chloride levels at 860ppm or mg/L or above are acutely toxic to freshwater aquatic life, meaning toxic within an hour to some freshwater aquatic organisms. Additionally, water might start to taste “off” or salty to us at around 250ppm or mg/L. ↩︎
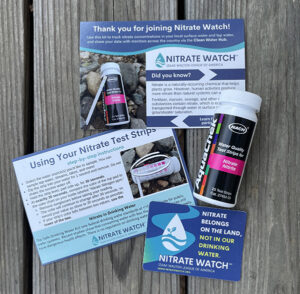 Your kit will include a bottle containing 25 nitrate test strips which you can use to test your water source(s) throughout the year. You’ll also receive postcards explaining how to use your nitrate test strips and how to share your Nitrate Watch results on the Clean Water Hub.
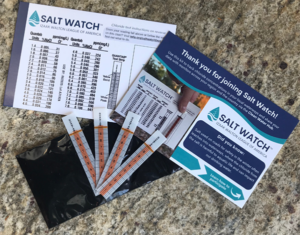 Your kit will include four test strips so you can test your waterway throughout the season. You’ll also receive a chart to help you interpret your results and a postcard with instructions for completing a Salt Watch test and reporting your findings.