Volunteers detect nitrate on the rise in waters nationwide
Nitrate Watch volunteers have been busy in 2025 and their data is starting to paint a picture. What does the data show us? Nitrate concentrations are steadily climbing in surface waters across the US. Let’s dive in.
The steep uptick in nitrate concentrations reported by community scientists is not an aberration. It is part of a phenomenon called the spring flush. In the spring and summer, the amount of nitrogen delivered to streams and groundwater often increases as a result of greater precipitation and the application of fertilizers and manure. Learn more about the spring flush and see what the data looked like this time last year in this blog from June 2024.
The figure below shows the average nitrate concentrations reported by Nitrate Watch and Save Our Streams volunteers in surface waters nationwide between January 1 and June 8, 2025. This includes readings reported for rivers, streams/creeks, lakes, ponds/wetlands, and drainage/outlet pipes and omits readings reported for tap water. This data summarizes 1795 results reported by 301 unique volunteers in 29 states plus the District of Columbia.
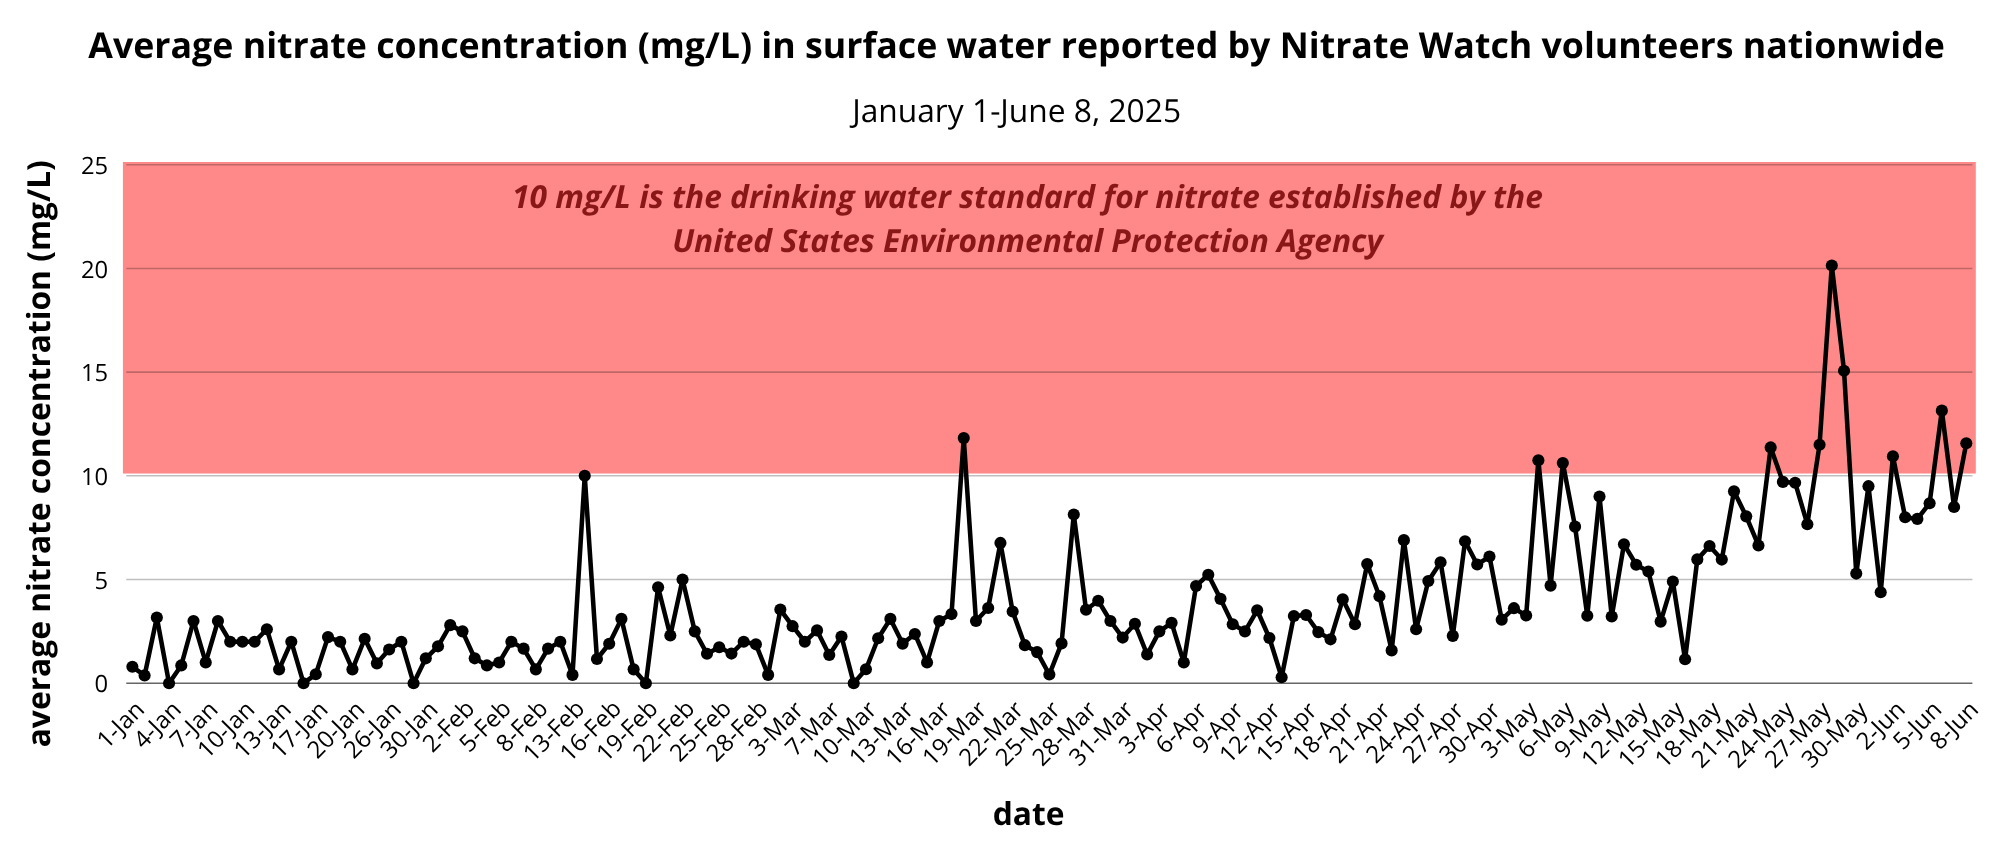
The average readings reported by volunteers nationwide often approached or exceeded the 10 mg/L mark, especially in May and June. 10 mg/L is the regulatory limit for nitrate in drinking water established by the United States Environmental Protection Agency. While there is no such national standard for nitrate in surface water, 10 mg/L is a meaningful benchmark nonetheless. About 1/3 of Americans receive their drinking water from a surface water source such as a river, lake, or reservoir. When source water contains nitrate levels in excess of 10 mg/L it must be diluted with another source of water or treated using expensive nitrate removal technology. Moreover, elevated nitrate can have catastrophic impacts on ecosystems, causing harmful algal blooms and contributing to hypoxic dead zones where aquatic life struggles to thrive.
While this trend tells an eye-opening story, it is important to remember that each waterbody is exposed to unique conditions. The Nitrate Watch data set consists of data collected by self-directed volunteers and readings are thus concentrated more heavily in locations where more volunteers are located. The most meaningful way to interact with Nitrate Watch is to use local data to drive local change. Find more information about what you can do for waterways near you at the end of this blog.
A large proportion of Nitrate Watch and Save Our Streams volunteers are located in Iowa. When we examine the data coming from Iowa in isolation, the spring flush trend is even more severe. The figure below shows the average surface water nitrate concentrations reported by volunteers in Iowa between January 1 and June 8, 2025. This data summarizes 917 results reported by 123 unique volunteers.
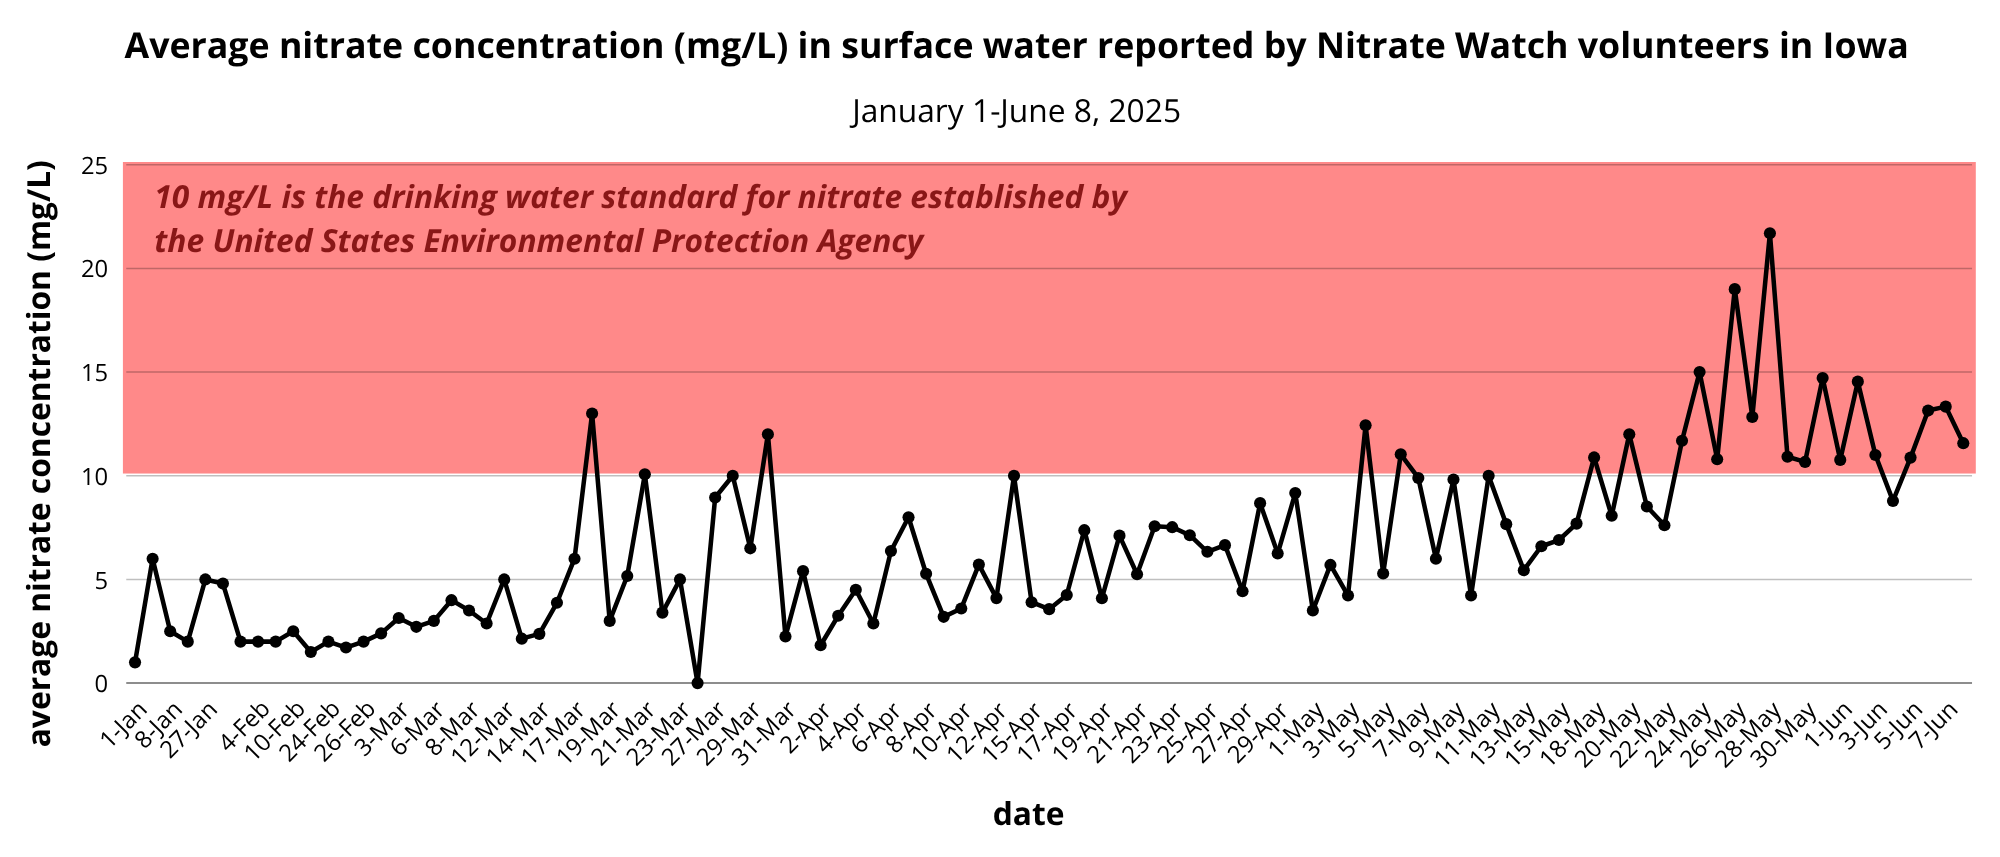
Just as with the national dataset, the data from Iowa shows nitrate levels on the rise. The average nitrate concentration in May and early June is above the 10 mg/L mark 50% of the time, a clear indication of high nitrogen inputs from human activities. This is taking place with the backdrop of Central Iowa Water Works’ ban on lawn watering. This ban is the first of its kind for Central Iowa and was brought about by high nitrate levels in the Raccoon River and Des Moines River which are used to provide drinking water for over 600,000 Iowans. Even with its nitrate removal facility operating at full capacity (at a reported cost of $14,000-$16,000 a day), the water utility is struggling to meet the needs of customers.
What can you do for waterways near you?
- Join Nitrate Watch and monitor waterways you care about. Visit www.nitratewatch.org to request a free test kit and start monitoring. You can monitor surface water as well as drinking water.
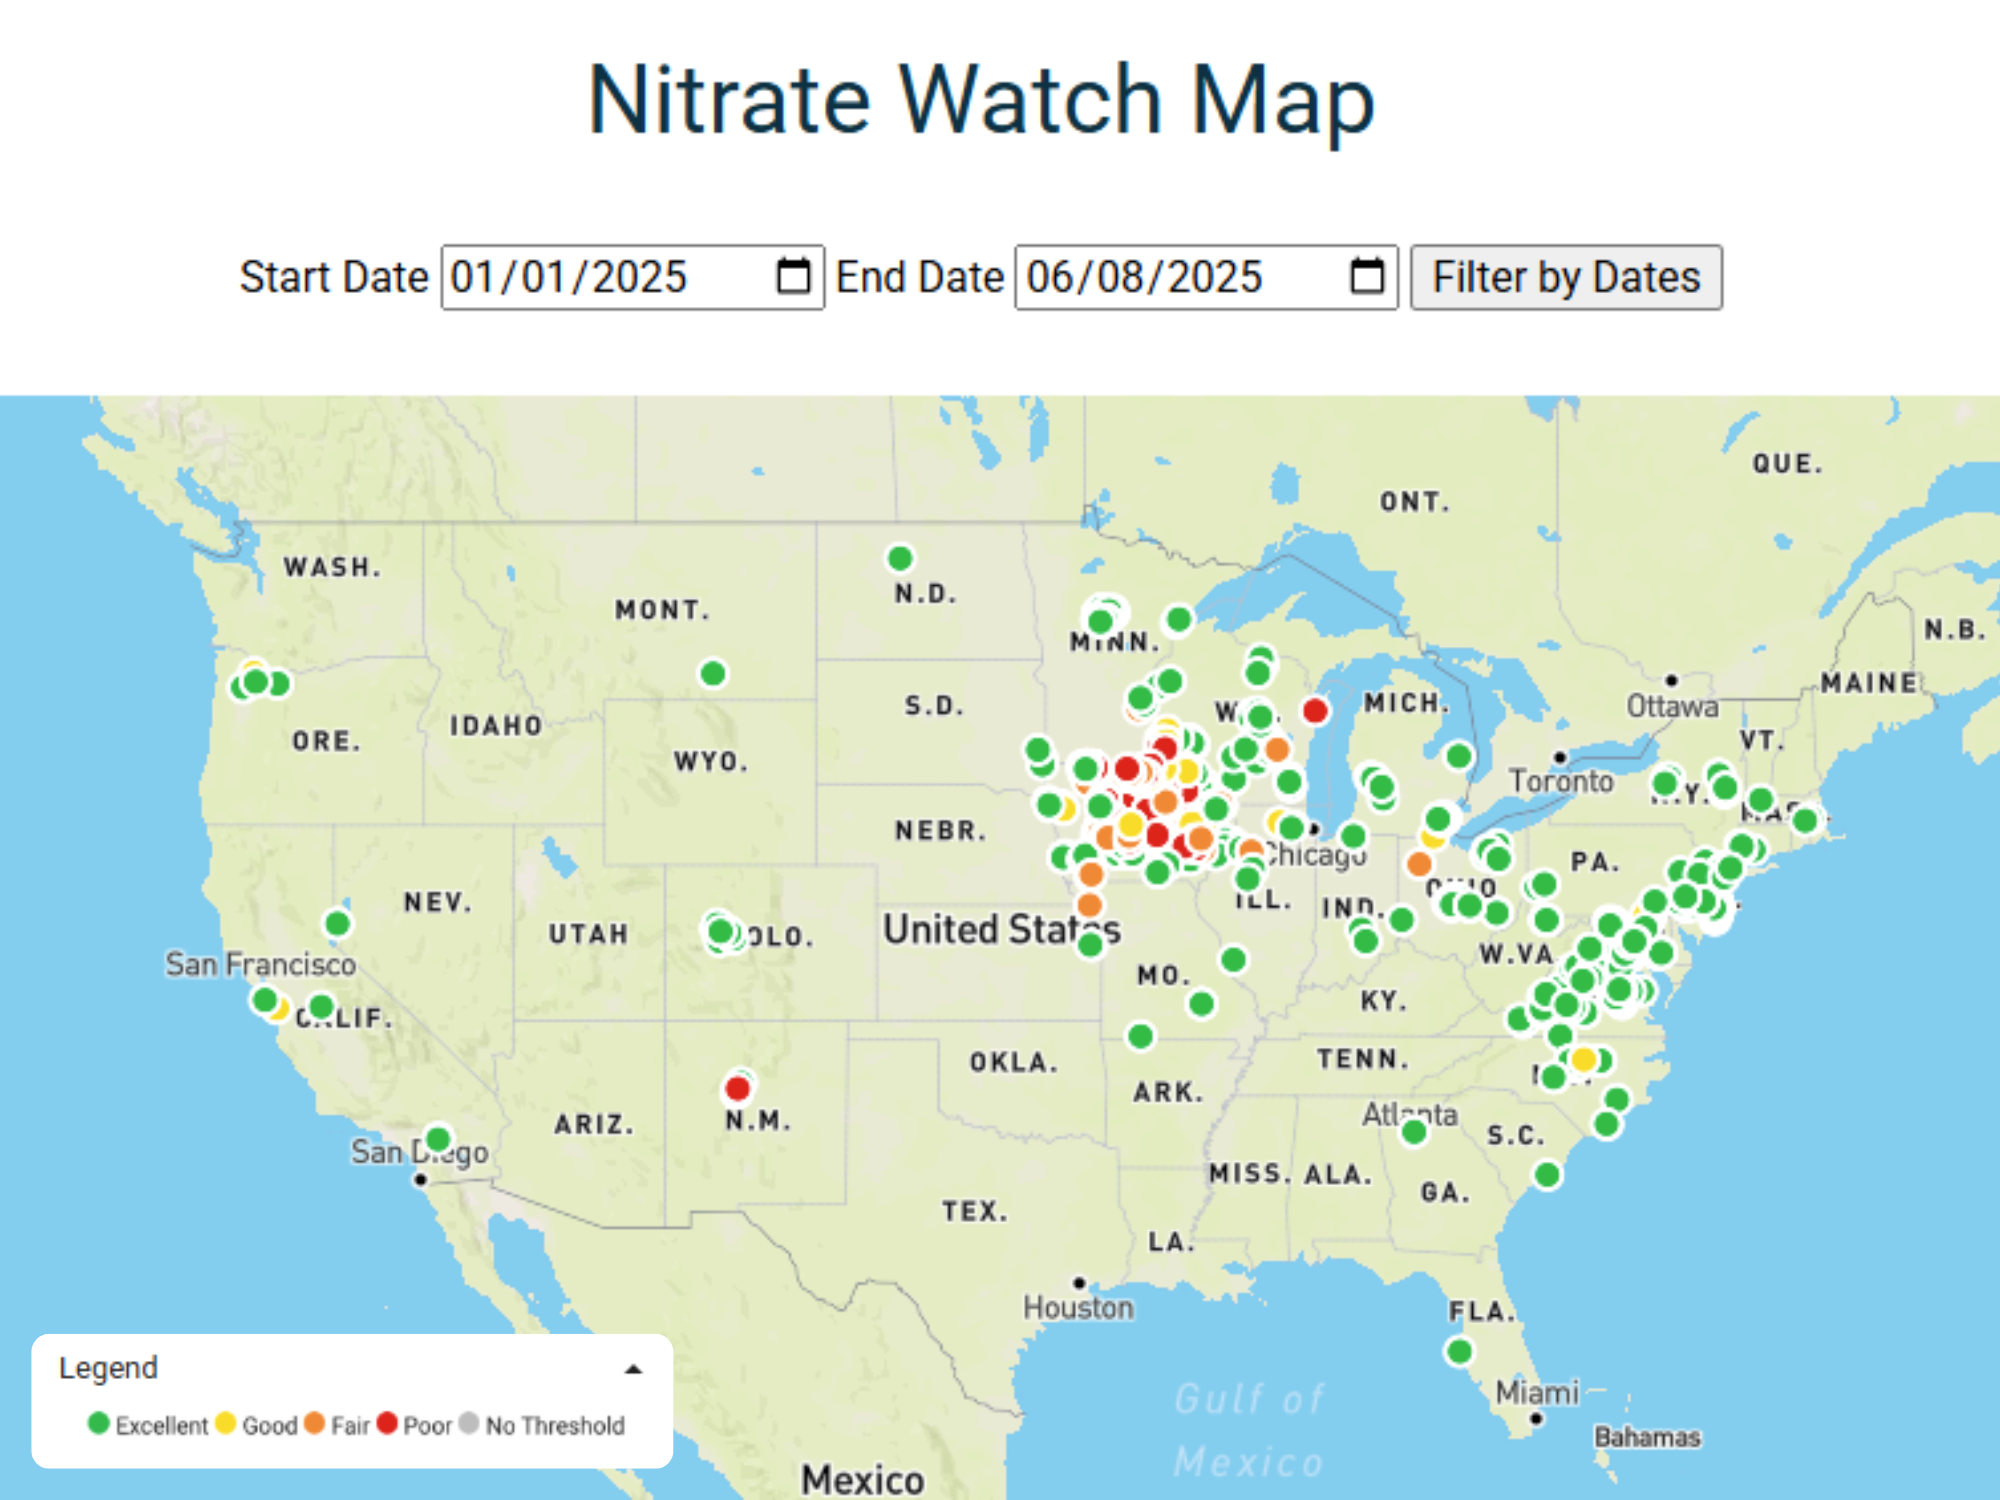
- Explore the data on the Clean Water Hub database and see what’s being reported in your area. The Clean Water Hub is free and open-access. Visit www.cleanwaterhub.org/maps/nitrate-watch to view an interactive map of nitrate data reported by our volunteers.
- Share this story within your network. To the water monitoring community, nitrate pollution is widely understood, but outside of these circles there is still a lack of awareness of this pollution problem and its impacts. Share this story, share your data, or share educational resources (like our fact sheets!) to help bring attention to this issue. Considering writing your local paper? Check out our LTE & Op-ed Guide for inspiration. Want to talk with your local elected officials? Let us know how we can support you.
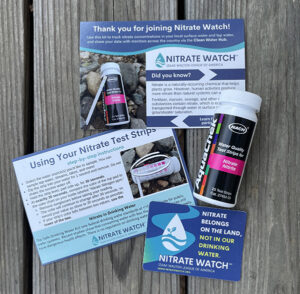 Your kit will include a bottle containing 25 nitrate test strips which you can use to test your water source(s) throughout the year. You’ll also receive postcards explaining how to use your nitrate test strips and how to share your Nitrate Watch results on the Clean Water Hub.
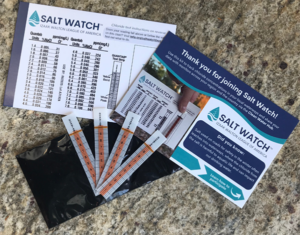 Your kit will include four test strips so you can test your waterway throughout the season. You’ll also receive a chart to help you interpret your results and a postcard with instructions for completing a Salt Watch test and reporting your findings.